
You receive a coin that is either fair (with a 50% probability of getting heads) or unfair (with a 42% probability). How can you detect the fair coin? And after how many flips can you assuredly say that?
Understanding
Let’s say you carry one of the coins and flip it twice. As all results with a particular number of heads are equally likely, we solely use this count to distinguish between outcomes. In the case of two tosses, they are 2, 1, and 0.
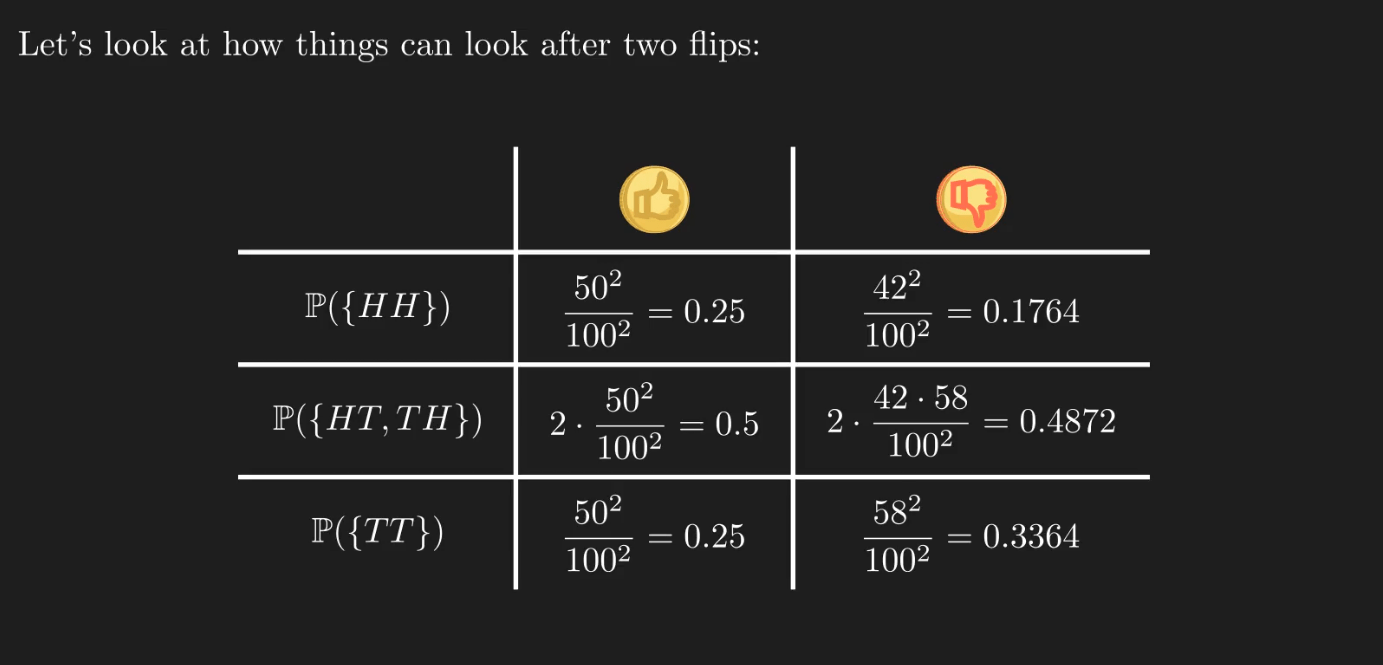
Regardless of the coin you receive, the most likely case is to get the “one head, one tail” value. Even though the biased coin is biased towards flipping tails, the odds of getting T twice are close between the two cases.
What conclusion can you draw if you get one head and one tail? It is legitimate to say that this result is more likely to occur when you have a fair coin. Nevertheless, the difference is negligible for us to be confident in any conclusion.
As expected, more than two flips are needed to distinguish the fair from the unfair coin. Unfortunately, no number of flips will guarantee 100% confidence in choosing the fair one. Even this biased coin has a non-zero probability of producing 1000 consecutive heads. Therefore, we must get comfortable with a level of confidence that is less than 100%. We can proceed with one of the most widely used thresholds in hypothesis testing, 95%.
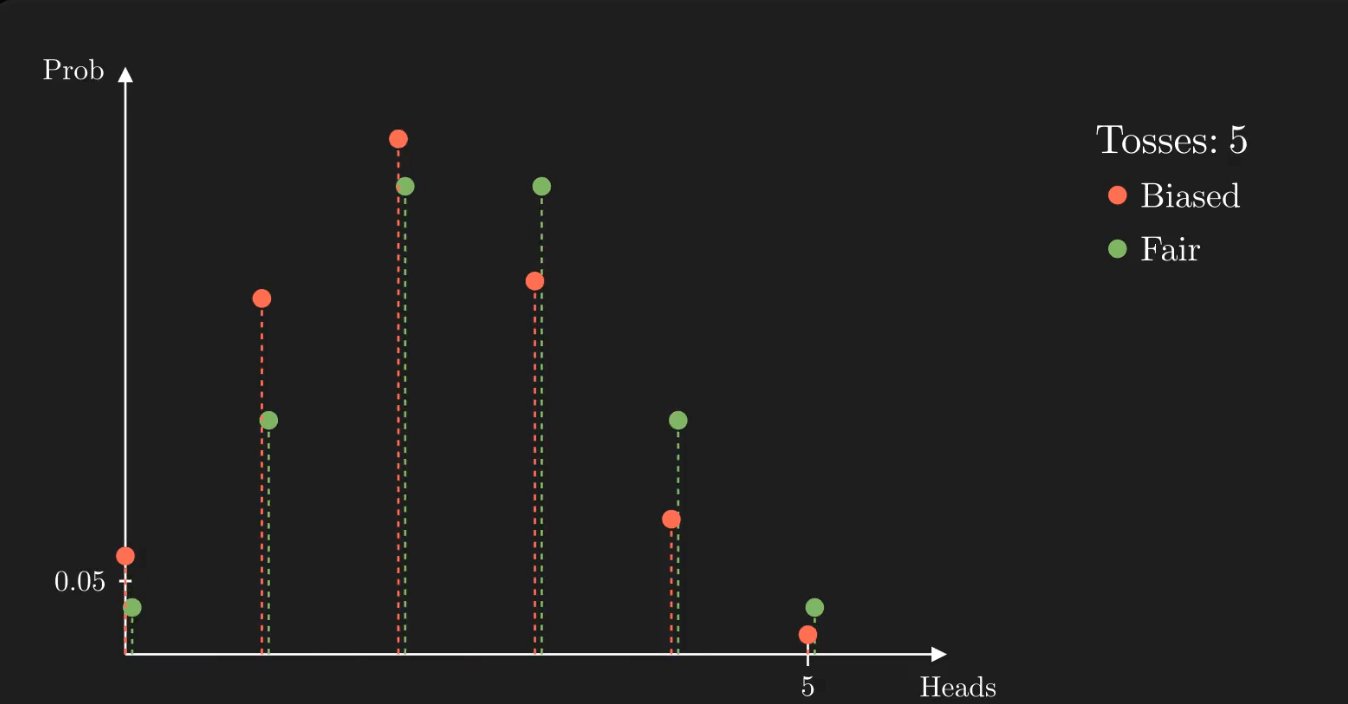
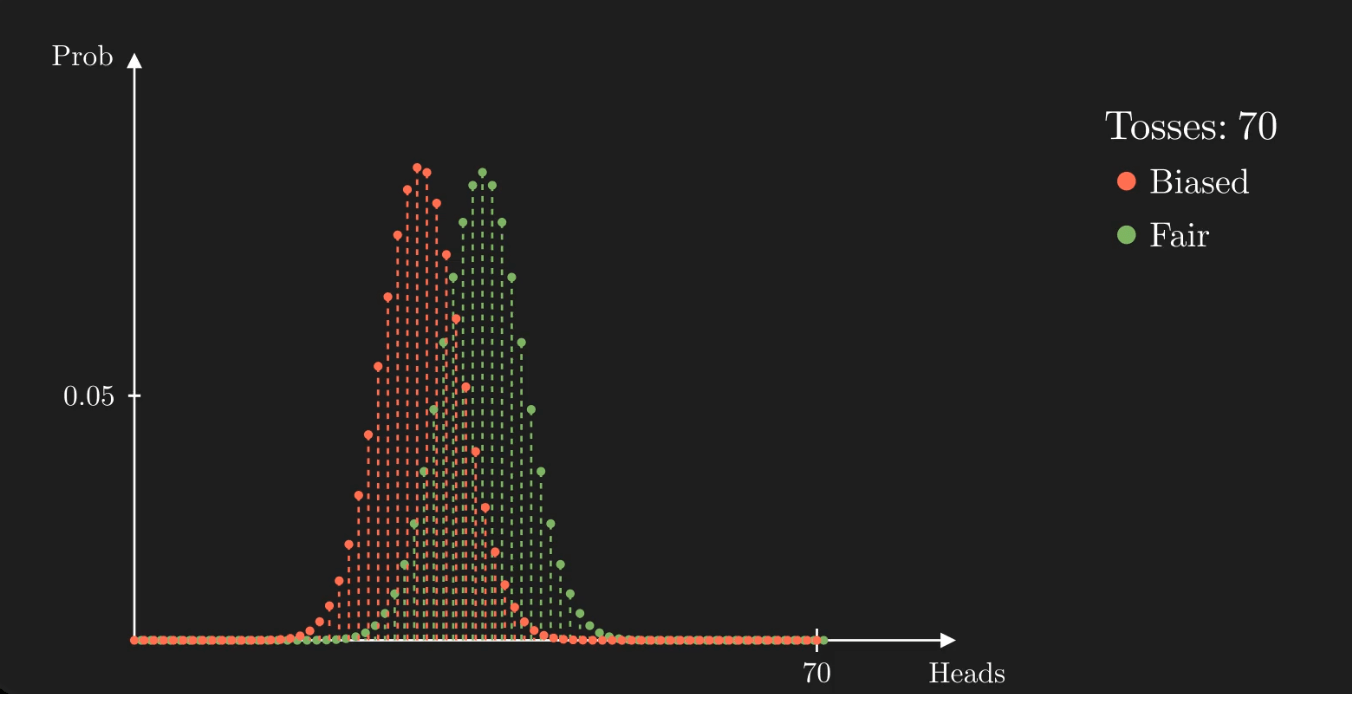
When the number of tosses is small, the distributions are indistinguishable. As the number of tosses grows, the distributions begin to differentiate one from the other. The less overlap between them, the more confident we can be that we gave the correct answer.
We’ve exposed all the issues one might encounter when trying to tell the coins apart. Is there a solution? Without a doubt, there are multiple ones, but I propose the one that makes the most sense to me.
Solution
Using the central limit theorem, we recognize that if we repeat the experiment, the proportion of heads after n tosses can be estimated by a Gaussian distribution if n is sufficiently large. This normal distribution has the mean exactly the value p (in this case, either 0.5 or 0.42) and the variance equal to  .
.
We compute the confidence interval for this distribution, given alpha and n, for which there is a 1-alpha probability that the observed value is in the range.
![\[\text{CI}_{n, \alpha} = \left[p - z_{\frac{\alpha}{2}}\sqrt{\dfrac{p(1-p)}{n}}, p + z_{\frac{\alpha}{2}}\sqrt{\dfrac{p(1-p)}{n}} \right]\]](https://atypicalquant.net/wp-content/ql-cache/quicklatex.com-cba937777ba254849ac8906bd7b38cc5_l3.png "Rendered by QuickLaTeX.com")
, where  is alpha level’s z-score for a two-tailed test.
Achieving an error rate of less than 5% implies the confidence interval has a 5% one-sided allowance. The range then has to have a 90% confidence, so 
What is the first value of flips that generates non-overlapping intervals at this alpha level? The answer to this is almost effortless. The upper limit of the 0.42 encompassing interval must be smaller than the lower limit of the 0.5 one:
![\[0.42 + 1.645 \cdot \sqrt{\dfrac{0.42\cdot (1-0.42)}{n}} < 0.5 - 1.645 \cdot \sqrt{\dfrac{0.5\cdot (1-0.5)}{n}}\]](https://atypicalquant.net/wp-content/ql-cache/quicklatex.com-84b45449a2d99f20f5eef1c284ecd31e_l3.png "Rendered by QuickLaTeX.com")
![\[\dfrac{\sqrt{0.42\cdot 0.58}+0.5}{\sqrt{n}} < \dfrac{0.08}{1.645}\]](https://atypicalquant.net/wp-content/ql-cache/quicklatex.com-dbd8e36c2fa1bf8295c78bc03d2e8829_l3.png "Rendered by QuickLaTeX.com")
![\[n > \left(\dfrac{(\sqrt{0.42\cdot 0.58}+0.5)\cdot 1.645}{0.08}\right)^2\]](https://atypicalquant.net/wp-content/ql-cache/quicklatex.com-c3e0ed9b00bd2234b6540599b38da28a_l3.png "Rendered by QuickLaTeX.com")
![\[n > 417.3\]](https://atypicalquant.net/wp-content/ql-cache/quicklatex.com-65e41adc3f742555e4cc2b37f1001116_l3.png "Rendered by QuickLaTeX.com")
n must be an integer, so the smallest value is 
![\text{CI}_{fair,90\%} \sim [0.380288, 0.459712]](https://atypicalquant.net/wp-content/ql-cache/quicklatex.com-8052ca60dcb015ee677bd25fa994db5e_l3.png "Rendered by QuickLaTeX.com")
![\text{CI}_{biased,90\%} \sim [0.459770, 0.540230]](https://atypicalquant.net/wp-content/ql-cache/quicklatex.com-5a5d5586491aae0f9b0147331a1f7a07_l3.png "Rendered by QuickLaTeX.com")
Let 
After assembling all the facts, a strategy takes shape. After 418 flips, if the observed ratio of heads is more than 0.459741, we guess the coin is unbiased. Otherwise, we say the converse, that it is biased.
Simulations
Up until this point, the game has been theoretical. What happens when we test the viability of the proposed strategy?
Simulate games and verify if the error rate is less than what we want, namely 5%:
from numpy import random as npr

p1 = 0.42
p2 = 0.5


thr = int(n_min*p_mid)

correct_guess = []
for i in range(int(1e7)):

    # Get a random coin
    coin = npr.choice(["F","B"])
    p = p1 if coin=='B' else p2

    # Simulate throws
    heads = npr.binomial(n_min, p)

    # Make your guess
    guess = 'B' if heads<=thr else "F"

    correct_guess.append(guess==coin)

np.mean(correct_guess)
We have one thing left to check: the value of n=418 is the smallest value for which this accuracy is obtained. For smaller sample sizes, the confidence intervals overlap, so we cannot determine the midpoint between them. But, using the same cutting point as before, we can plot the accuracy of our guess against the value of n.
p1 = 0.42
p2 = 0.5

d = {}

for n_min in range(20,420,20):
    midpoint = 0.45974

    thr = int(n_min*midpoint)

    correct_guess = []
    for i in range(int(1e6)):

        # Get a random coin
        coin = npr.choice(["F","B"])
        p = p1 if coin=='B' else p2

        # Simulate throws
        heads = npr.binomial(n_min, p)

        # Make your guess
        guess = 'B' if heads<=thr else "F"

        correct_guess.append(guess==coin)

    d[n_min] = np.mean(correct_guess)